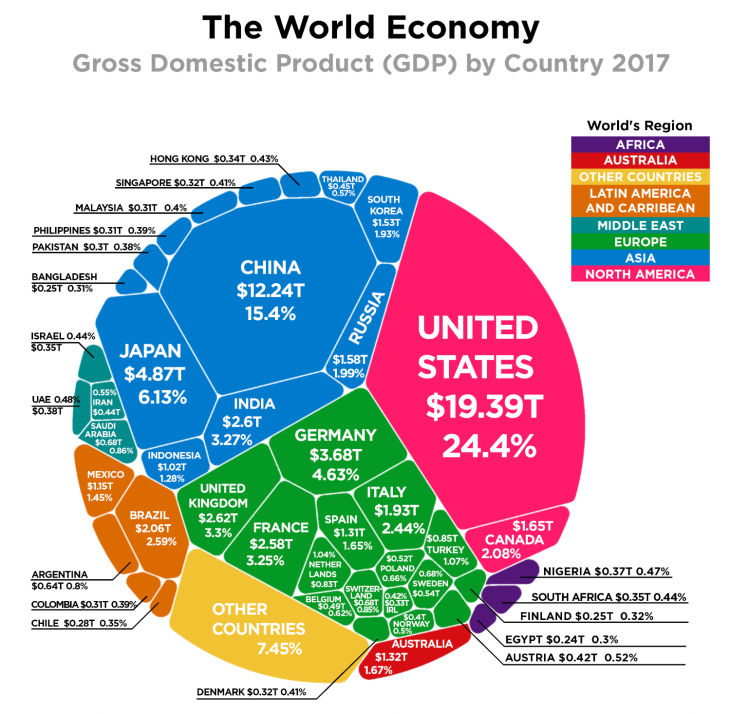
The World GDP as a pie chart. A rough and simple way to look at is: US ~1/4, China ~1/5, Europe ~1/4, Japan ~5%, India ~5%, everyone else ~20%.
The World GDP as a pie chart. A rough and simple way to look at is: US ~1/4, China ~1/5, Europe ~1/4, Japan ~5%, India ~5%, everyone else ~20%.

Visit the link to interactively play with the data: https://public.tableau.com/profile/brad.ballard#!/vizhome/Top50CitiesbyGDPComparision/Dashboard
We often see lists of GDP by country, but rarely by city. This is puzzling because most countries are empty space and GDP output is concentrated in a few small areas. For example, about 50% of US GDP is generated on only 2% of its area – namely: cities. This is also the case around the world.
To put the importance of these 50 cities into perspective. The top 25 cities in the world generate 15.5 trillion dollars in GDP or 20.1% of total world GDP (2014 numbers). They do this with only 4.7% of world population and have a GDP per capita of 44 thousand dollars (4 times world average). The top 50 cities in the world generate 22.6 trillion dollars in GDP or 29.4% of total world GDP (2014 numbers). They do this with only 8.2% of world population and have a GDP per capita of 37 thousand dollars (3.5 times world average).
The GDP centers are clustered in geographic regions in North America, Western Europe, and Eastern Asia. Only a few cities are represented from the southern hemisphere and none from Africa or the Middle East. Asian cities tend to be larger in population, number of skyscrapers, and lower in GDP per capita. North American and Europen cities tend to have small-to-medium populations, low density, and a high GDP per capita.


The graphic above displays the change in regional and country GDP as a fraction of global GDP from the period 1820 through 2012. The picture tells a story of the rise of ‘the west’ during the industrial revolution and the corresponding fall of the Asian world powers from 1820 through the mid 1900’s. Then following economic reforms in the late 1900’s, Asian giants re-emerging and gaining market share of global GDP corresponding with a fall by western powers.
In 1820, China and India together made up 49% of world GDP, but by the late 1970’s this figure had fallen to less than 5% combined. That is, China and India – countries that make up 37% of the world population, only accounted for 5% of world GDP. Since that time, China and India have had drastic economic growth and now account for 21% of global GDP.
The graphic also tells the tale of the United States emerging as a global super power. From 2% of global GDP in 1820 to a peak of 36% following WWII. In fact, the 36% of world GDP figure is the highest mark by any country in history – All this accomplished by a country with only 5% of world population. The stagnate economic growth since the 1970’s is comparable to Europe, although not quite as drastic. The US and Europe still account for 35% of world GDP combined.
