US Labor Market Trends

Over the past few decades the US labor market is undergoing some noticeable trends. One such trend is a consistent decrease in the percentage of the US population employed following a recession (highlighted in grey in the top graphic). This makes since as economic recessions cause unemployment, but a puzzling trends is following – After each of the past two recession the fraction of US population employed (the labor participation rate) has not returned to the previous pre-recession level. In 2001, labor participation was around 64.5%, but only returned to 63.5% by 2007 before the great recession hit. The 2007 recession’s impact has been even more drastic pushing labor participation down further to just 58.5%.

The US labor force composition is also changing quite drastically over the past 60 years. In 1950, the labor participation for men was 87% and for women 32%. That is, 87% of working age men where employed and just 32% of working age women. By 2010, labor participation for men fell to 70% and women’s participation rose to just under 60%. We are becoming a more gender neutral labor force.

POST_US labor market trends.PNG

How Old is Your Country?

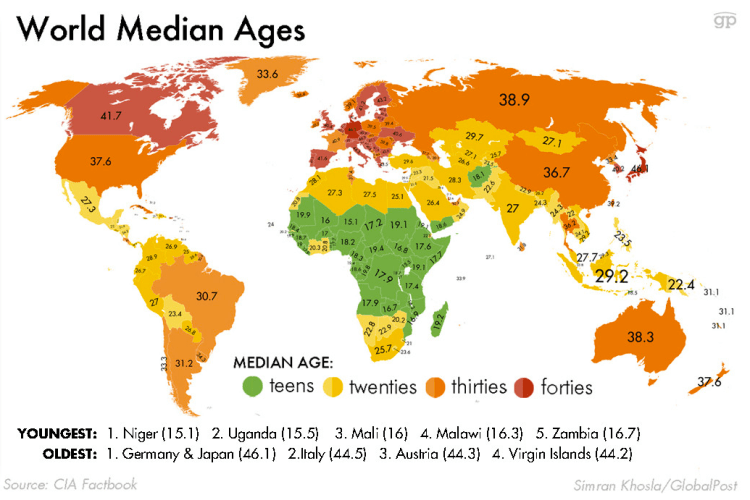
The map below displays countries by the median age per citizen. Germany and Japan are the world’s oldest countries with an average age of 46; Conversely, Niger and Uganda are the world’s youngest countries with an average age of 15!

This map signals the future population tends coming — Europe is the world’s oldest continent by median age has been enmeshed in economic stagnation and debt crises (likewise for Japan) — These trends are likely to persistent into the future. Africa is the world’s youngest continent and is full of potential and economic growth. The current projections are Africa’s population will double from 1 billion to 2 billion people in the next 30 years. These drastic demographic changes are likely to upheave society (and possibly governments) in the region as these energetic youngsters will reshape the status quo.

POST_Avg age by country.png

Break-even Oil Prices

The significant drop in the price of oil in the past few years has thrown many government regimes into question — especially those in the Middle East. The graphic below displays various Middle Eastern governments and what they need to price of oil to be in order to break-even on current payment obligations. Even foreign exchange rich Saudi Arabia will go broke in just five years if oil prices continue at this level.

POST_Breakeven prices oil.png

Oil Imports

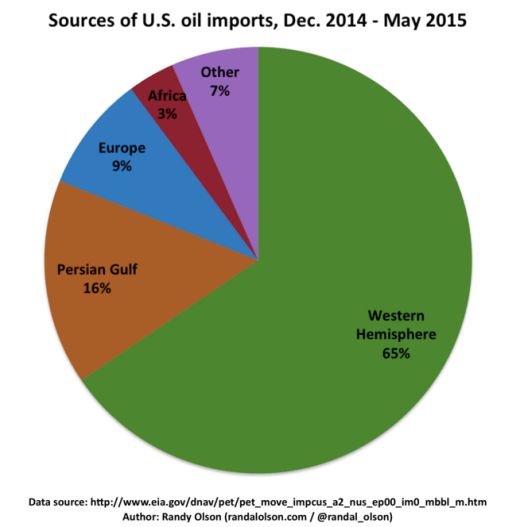
Screen Shot 2016-01-23 at 11.38.24 PM.png

In the mist of an energy production boom in the US, the amount of oil imported from foreign countries in 2014 fell to 27% (the lowest level since 1985). Over the past decade or so, the US as also been importing less oil from the Middle East region and increasing its imports from the Western Hemisphere (40% from Canada, 10% from Mexico, 10% from Venezuela). In fact, Canada accounts for 3.5 times the oil imports of Saudi Arabia to the US (3,401 thousand barrels per day compared to 983 thousand barrels per day).

Across the Pacific, China is increasing its reliance on Middle East oil — and presumably, as a result, increasing its presence in the region. In fact, in a recent New York Times article it was announced that China will be establishing its first overseas military output in Djibouti. The East African nation sits at the entrance point of the Red Sea — the waterway boarding Saudi Arabia to the east. As shown in the figure below, China now receives the majority (51.2%) of its oil imports from the Middle East and by 2035 imports from the region are expected to double. China oil imports.png

Coal Regulations

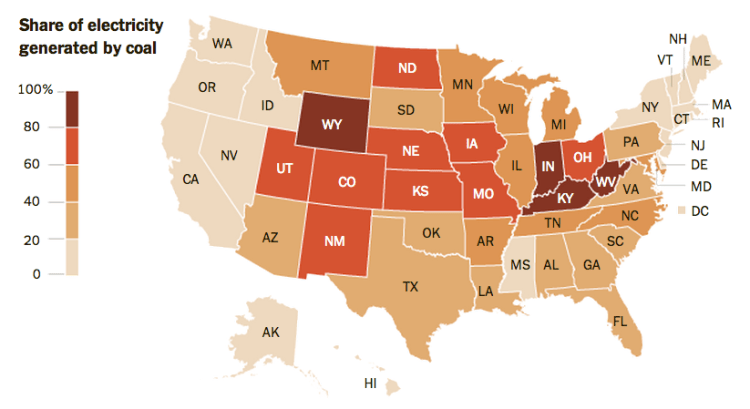
How will new coal regulations impact where you live? The map below displays the relative share of electricity generated by coal. Well known coal producing giants: Wyoming, West Virginia, and Kentucky — each of whom generate over 90% of their energy from coal — stand to lose most from new regulations that increase the price of energy derived from coal.

POST_US Coal.png

Energy Independence

Over the next several decades, many countries oil and gas dependence will grow as their nation’s economy expands. South Korea and Japan (in the upper right counter) are both already highly dependent on energy imports and will continue to remain so in the near future. Meanwhile in Europe, the persistent lack of economic growth is expected to lessen the upward trend in energy imports in the near term.

Developing Asia (China, India, and ASEAN) will see massive growth in oil and gas imports over the next 25 years as displayed by the drastic ‘up and to the left’ movement on the graphic below. One glaring outlier in the world energy picture is the United States —  who is currently undergoing a complete energy transformation due in large part to the break through technology of ‘fracking’. The United States will move from being the world’s largest energy importer to a net energy exporter!

20121117_woc449.png

Source: The Economist