FIFA World Cup Stats

Screen Shot 2018-07-03 at 8.35.03 AM.png

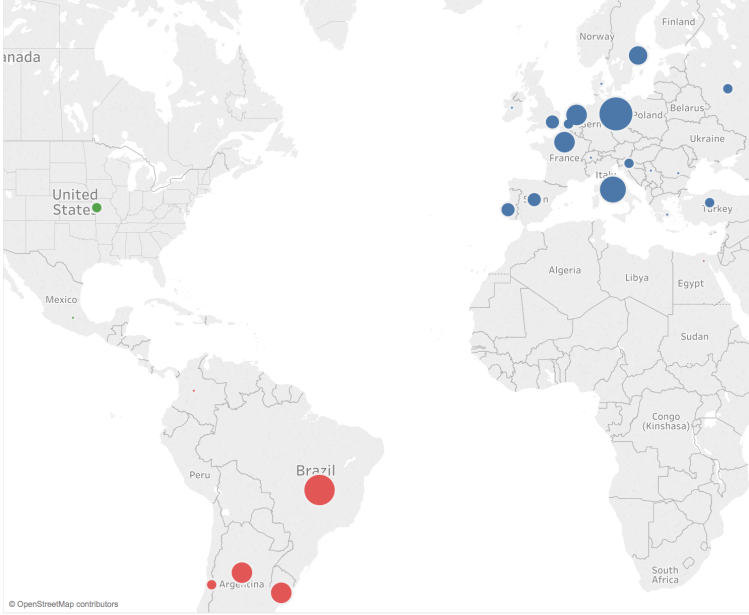
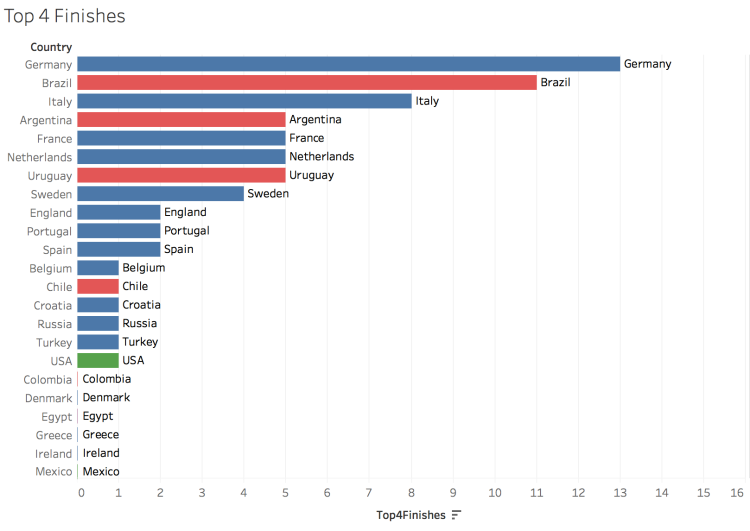
Above is map is displaying the number of top 4 finishes for each country in the World Cup (1930 – 2014). The size of the bubbles represents the number of top 4 finishes and is located in the geographic area of the country. Europe is colored blue, South America red, and North America green. This map is intended to display the concentration of top teams in Europe and South America — there has only been a few times ever that a team outside those two regions finished in the top 4. This same data is shown below in a bar chart.

Screen Shot 2018-07-03 at 8.38.27 AM.png

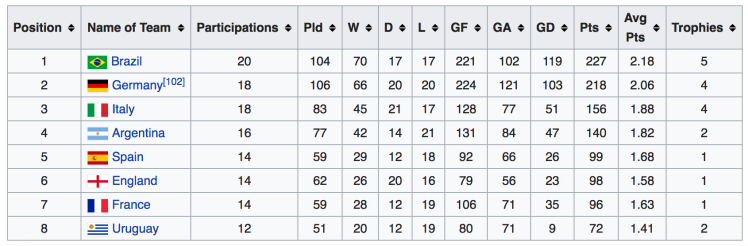
Below is the historical performance of the top 8 teams in the World Cup.

Screen Shot 2018-07-03 at 8.21.00 AM.png

Below is FIFA’s historical ranking for countries. The FIFA world ranking formula was created in 1993 and the average ranking from then until June 2018 is shown on the third column. Brazil is the worlds top team with an average ranking of 3rd, next Germany with an average of 5th — tied with Spain and Argentina.

Screen Shot 2018-07-03 at 8.55.30 AM.png

Advertisement

BRIC Comparison

BRIC-compare.png

Above is a comparison of GDP per capita (nominal) figures for BRIC countries – that is, Brazil, Russia, India, and China. The data displayed ranges from 1980 through 2016. A few things stand out, both Brazil and Russia’s economies were overvalued post-2007 financial crisis, driven by high oil prices that have regressed back to the mean and inflated currently values. China economy has leveled off in recent years and India is still much poorer than the other three BRIC economies, yet show promise moving forward.

Country Exports to the US

US imports from Americas.png

The map above displays each country in the Americas largest export to the United States. It is color coded by various categories listed in the legend. Note that Cuba is grayed out with “No Data” as the US does not trade with them due to the long-standing embargo. Latin America’s two largest economies (Brazil and Mexico) export industrial goods to the US – Planes, Spacecraft, and Cars – while most other countries in South America export natural resources (Sugar, Gold, and Oil). The Caribbean typically exports food products and textiles: bananas, fish, t-shirt, sweaters, etc.