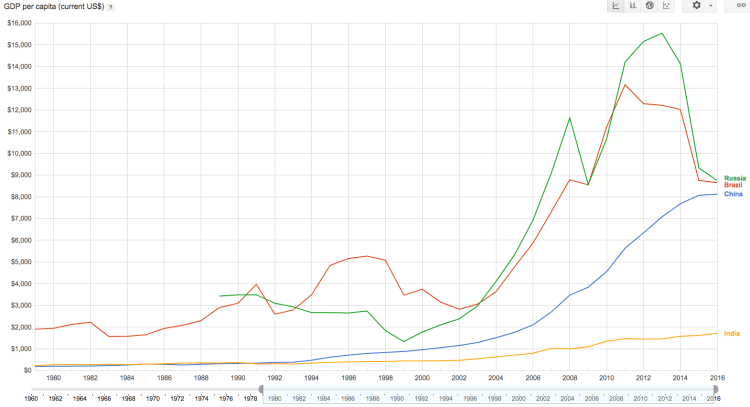
Above is a comparison of GDP per capita (nominal) figures for BRIC countries – that is, Brazil, Russia, India, and China. The data displayed ranges from 1980 through 2016. A few things stand out, both Brazil and Russia’s economies were overvalued post-2007 financial crisis, driven by high oil prices that have regressed back to the mean and inflated currently values. China economy has leveled off in recent years and India is still much poorer than the other three BRIC economies, yet show promise moving forward.
