Above is a map of Europe displaying whether a country has a GDP per capita less than or greater than Turkey. The data is from the IMF in Oct 2017. Turkey has a GDP per capita of $24,912 at Purchasing Power Parity (PPP). The data displays the income divide Europe where all of western Europe and Russia (labeled in Blue) have a higher standard of living than Turkey and most the former USSR and former Yugoslavia countries (labeled Red) have a lower standard of living than Turkey. The income differences help to explain some of the internal migration within Europe.
Tag Archives: Demography
Coke, Soda, or Pop
The United States has various regional quirks, one of which is what do you call a carbonated soft drink. Where I grew up in Ohio, we called it a Pop. As in, can you give me a pop? When I moved to South Carolina, I noticed that everyone referred to it as a ‘Coke’ – even if they were talking about another soft drink. Now where I live in California, it’s called a Soda.
Religion in China
China is a large and diverse country with stark geographic differences. One particular regional difference is religion. The Communist Party of China is officially atheist and party members are strongly discouraged from holding religious faith, however, China does officially sanction five religious organizations – Buddhism, Taoism, Islam, Protestant Christianity, and Catholicism (the Chinese Patriotic Catholic Association is not recognized by the Vatican). Above are six maps of China, each showing the regional concentration of the largest faiths in China. The northwestern desert region is Islamic, the southwestern mountainous region is Buddhist, the northeast is Chinese folk religions, and the southeast Taoist.
The above maps may be a little misleading as they display the percentage for various religions, but the scale on each map is different and the population in the western provinces are much smaller than the eastern ones. For example, the Christianity scale only goes up to 7% (for the darkest shade) whereas Buddhism reaches a high of 70% and Islam 50%. Overall, the majority of Chinese are unaffiliated with any religion or practice some ancient folk religion (73% of the population). The other major religions are Buddhism 16%, Taoism 7%, Christianity 2%, and Islam 0.5%.
Africa Birth Rate
No continent in the world outside of Africa averages more than 2.5 children per women – Africa averages 5! A society or country will remain at the same population level if it remains at the replacement level – 2.1 children per women – below this point, the location’s population is decreasing. Africa’s rate of 5 children per women is well above the replacement level, if fact, at this rate the continent will double in population in the next 30 years. As shown in the map of above, much of this growth is happening between Sub-Saharan Africa and north of southern Africa.
It also important to note the differences in birth rates intra-country. Nigeria is the most populous country in Africa with 185 million people and is the 7th largest in the world. Its fertility rate is 5.5 children per women which is the highest rate for any country already above 100 million people. The fertility rate is not evenly distributed (as pictured below) with a high rate of 8.4 children per women in rural northern regions compared with 3.8 in coastal urbanized areas. A staggering statistic is that: According to 2013 data, approximately 17% of Zamfara state’s women (the highest figure of 8.4 on this map) are currently pregnant!
Lactose Intolerance
The majority of the world is lactose intolerant. Above is a color-coded map displaying the percentage of people in each country who are lactose intolerant.
US Hispanic Population
The map on the left displays the Hispanic percentage for each US state in 1940. Contrast that with the map on the right displaying the Hispanic percentage for each US state in 2010. The Hispanic population in 1940 was mostly concentrated in the southwest border states of Arizona, New Mexico, and Texas, but over the next 70 years, migration and birth rates spread the population throughout the entire southwest, west coast, and major cities on the east coast. New Mexico continues to be the US state with the highest concentration of Hispanic population with 41% in 1940 to 46% in 2010. Nationwide the Hispanic population has increased dramatically over the past 70 years – from around 1.4% in 1940 to 16.3% in 2010!
Coastal Population
Above is a map comparing the population all of the United States coastal counties (counties boarding the Atlantic or Pacific Oceans) to the same population of counties from mid-point of the US spreading out. The map above has equal population – 104 million to 104 million. The area (in square miles) of the middle counties is 6.5 times the area of the coastal counties.
Bay Area Median Home Price 2016
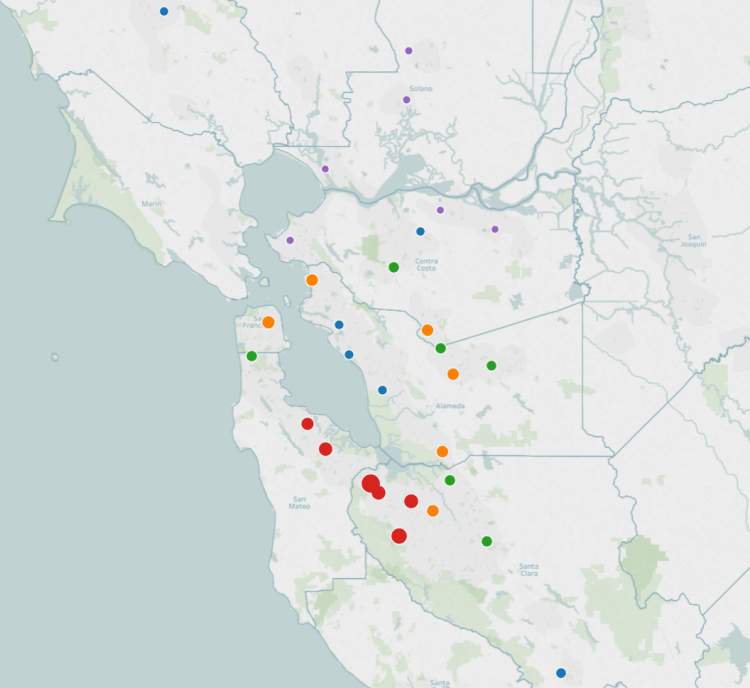
The San Francisco Bay Area is one of the most expensive places to live in the United States. The map above displays the median home price for the top 30 most populated cities in the Bay Area. The larger the bubble, the higher the median home price. The bubbles are also color coded – Red the highest 20%, Orange the next 20%, then Green, Blue, and Purple the lowest 20% by median home price.
Regionally, the cities comprising Silicon Valley are the most expensive and the cities in the northeastern bay are the cheapest. In order, the most expensive cities in the bay area by median home price (via Zillow) as of 2016: Palo Alto at 2.5 million, Cupertino 1.8 million, Mountain View 1.4 million, Sunnyvale 1.4 million, Redwood City 1.3 million, San Mateo 1.1 million, and San Francisco 1.1 million.
The most affordable housing in the Bay Area (of the top 30 by population) are: Richmond 411k, Vacaville 391k, Fairfield 390k, Antioch 364k, Pittsburg 357k, and Vallejo 326k.
Canada’s Immigration
Above is a graphic displaying Canada’s foreign-born population by decade ranging from 1871 through 2011. The size of the bubbles below the graphic display the number of total migrants arriving in millions by decade. Broadly speaking, Canada’s immigration has occurred in three waves. First, a British Isles majority wave from 1871 till the mid-1900’s, second, a European majority wave from the mid-1900’s through 1990, and third, an Asian majority wave from 1990 running through the present.
Job Tenure by Cohort
Above is a graphic displaying the number of years working for the same employer relative to birth year. What is clear is that over time, people are working for the same employer for less years on average. This trend is consistent across all age brackets. The change is quite stark, the average worker born in 1933 stayed with the same employer for 13 years, a worker born in 1943 for 10 years, and for someone born in 1993 only one year on average. The takeaway, the workforce is becoming more dynamic and workers in the 21st century economy can expect to work for ten or more employers over the course of their career.