US Average Daily Sunlight

Screen Shot 2018-02-21 at 8.10.52 PM.png

Above is a map measuring solar radiation per square meter, averaged to each county within the lower 48 states of the US. The units are a little difficult to translate, but the difference between the extremes (dark purple to light yellow) is a factor of two. This means that cities such as Los Angeles, Las Vegas, and Phoenix get about twice as much sunlight each day as Seattle, Portland, or Cleveland.

Advertisement

The World’s largest Islands

a1nr8zgq4mzz.pngAustralia is considered one of the world’s six continents, although some consider it the world’s largest island. If this is the case, the map above displays Australia’s land area compared with the next largest islands in the world. The next closest (in area) to Australia is Greenland with an area only 27% the size, followed by New Guinea at only 10% the size of Australia. The top 20 largest islands by area are displays and listed on the right.

The Country Across the Ocean

eNrIVp3.jpg

The map above displays the western hemisphere and shows with extending a horizontal line (longitudinal) which country is across the ocean from it. This is an interesting perspective from which to view the world given that these matching countries are likely to share the same climate and culture based on their position in the world. It’s amazing to see the north-south size of Africa projected onto the Americas – Its northern reach with Morocco across from (approximately) Washington DC in the United States to its southern point with South Africa across from Buenos Aires. Another stunning display is the north-south size of Japan which it the closest country to virtually the entire west coast of the US.

Coke, Soda, or Pop

soda-pop.png

The United States has various regional quirks, one of which is what do you call a carbonated soft drink. Where I grew up in Ohio, we called it a Pop. As in, can you give me a pop? When I moved to South Carolina, I noticed that everyone referred to it as a ‘Coke’ – even if they were talking about another soft drink. Now where I live in California, it’s called a Soda.

Religion in China

Screen Shot 2017-09-29 at 4.25.29 PM.png

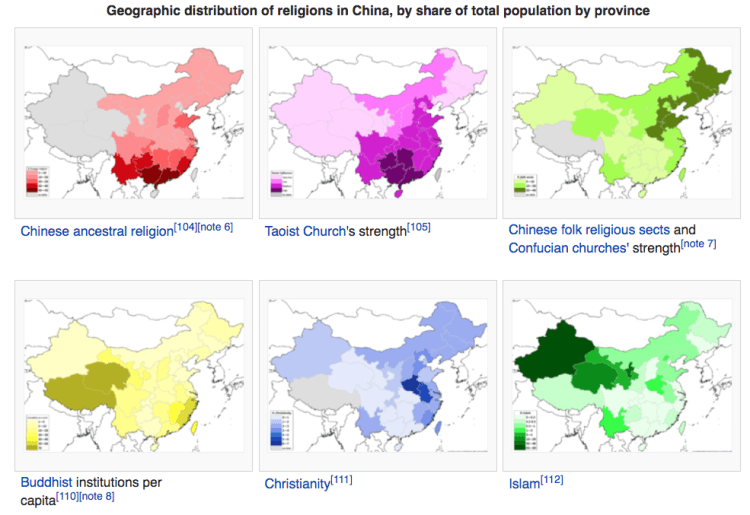
China is a large and diverse country with stark geographic differences. One particular regional difference is religion. The Communist Party of China is officially atheist and party members are strongly discouraged from holding religious faith, however, China does officially sanction five religious organizations – Buddhism, Taoism, Islam, Protestant Christianity, and Catholicism (the Chinese Patriotic Catholic Association is not recognized by the Vatican). Above are six maps of China, each showing the regional concentration of the largest faiths in China. The northwestern desert region is Islamic, the southwestern mountainous region is Buddhist, the northeast is Chinese folk religions, and the southeast Taoist.

The above maps may be a little misleading as they display the percentage for various religions, but the scale on each map is different and the population in the western provinces are much smaller than the eastern ones. For example, the Christianity scale only goes up to 7% (for the darkest shade) whereas Buddhism reaches a high of 70% and Islam 50%. Overall, the majority of Chinese are unaffiliated with any religion or practice some ancient folk religion (73% of the population). The other major religions are Buddhism 16%, Taoism 7%, Christianity 2%, and Islam 0.5%.

US Rivers by Flow

US-Rivers-flow.png

Above is a map showing the average flow in cubic feet per second for the major rivers in the United States. What is clear is how much water flows through the Mississippi River, especially after the Missouri and Ohio Rivers add to it. Staying with the rivers theme, below is a map displaying the major US rivers as if they were a subway map. Transit along these routes was common before railroads were laid coast-to-coast across the US.

SubwayRivers.png

The US in State Highway Shields

Screen Shot 2017-06-09 at 3.16.49 PM.png

If you’re like me, you been across the US and noticed the various State Highway Marker Shields. The above map displays all of them, positioned over each state. Some have historical/social meaning (California – the shape of a shovel (as in digging for gold), Utah – a beehive (a signal of Mormonism), or Pennsylvania – a keystone, as in the Keystone state that connects the east coast to the mid-west), some are merely the outline of the state shape (Idaho, Arizona, Missouri, etc.), and some have no significance at all (Texas, Montana, Illinois, etc.). What’s your sign?

Sunset Times in Europe and America

SunsetNorthAm.png

Above is a map displaying the local sunset time on the summer solstice (June 20th), the longest sunlight day of the year. Time zones are indicated by gray vertical lines. You will notice that ‘local’ sunset time will vary based upon your east-west location within your time zone and also vary depending upon your north-south location within your time zone. Said differently, areas to the northwest within their time zones will have a later local sunset time. For example, eastern Alabama (far southeast) has a local sunset time before 8:00 pm, whereas northwestern North Dakota has a local sunset time close to 10:00 pm (both are in US Central Time Zone). Some areas are so far north that, during the summer months, they experience 24 hours of daylight (and conversely, during the winter months 24 hours of darkness). The map of Europe below also displays the local sunset time on the summer solstice.

SunsetEurope.png