


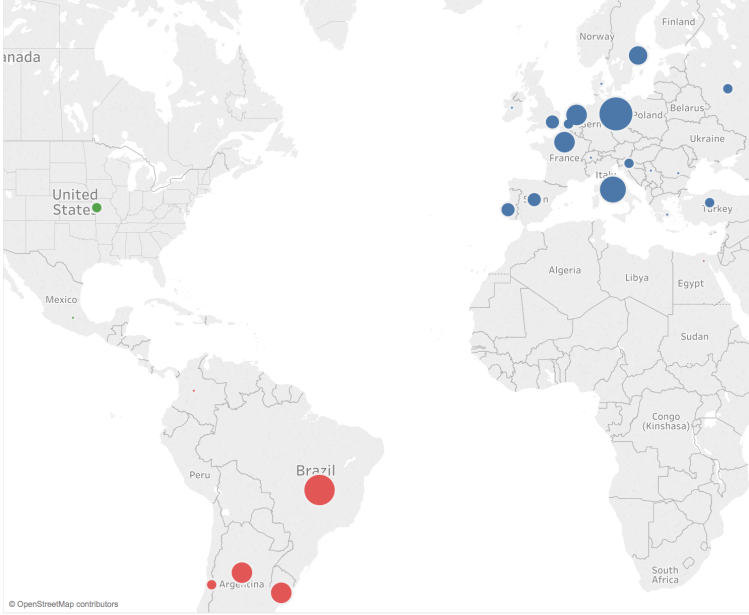
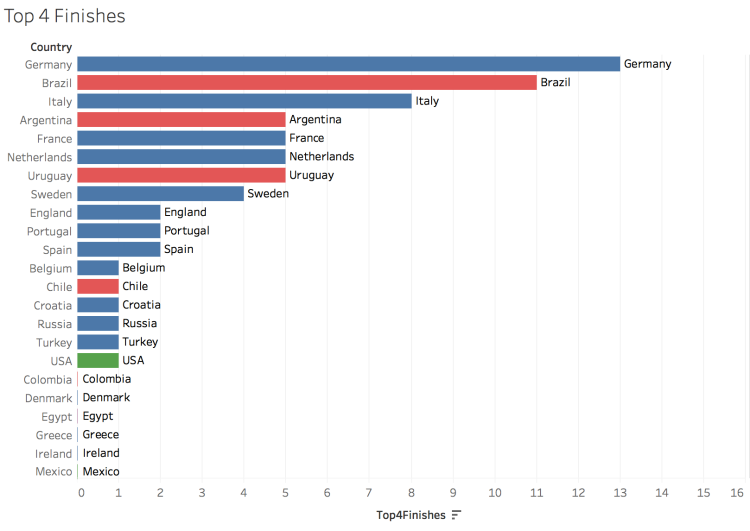
Above is map is displaying the number of top 4 finishes for each country in the World Cup (1930 – 2014). The size of the bubbles represents the number of top 4 finishes and is located in the geographic area of the country. Europe is colored blue, South America red, and North America green. This map is intended to display the concentration of top teams in Europe and South America — there has only been a few times ever that a team outside those two regions finished in the top 4. This same data is shown below in a bar chart.
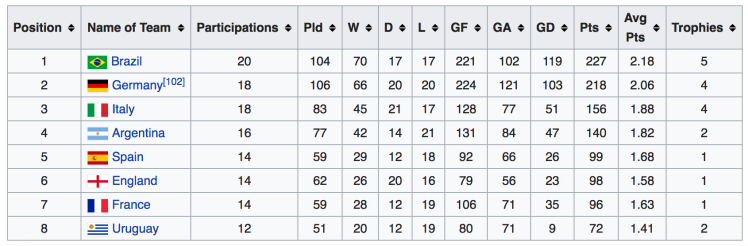
Below is the historical performance of the top 8 teams in the World Cup.
Below is FIFA’s historical ranking for countries. The FIFA world ranking formula was created in 1993 and the average ranking from then until June 2018 is shown on the third column. Brazil is the worlds top team with an average ranking of 3rd, next Germany with an average of 5th — tied with Spain and Argentina.


In 2015, the percentage of the population 65+ years old in OECD countries was 28%, this figure is expected to rise to over 50% by 2050. The graphic above display where each country stands or the population projects in the next 40 years. Japan, Italy, and Greece are already the oldest countries with 46%, 37%, and 35% of their population over 65 years old (in 2015), by 2050 these countries are projected to continue to lead with 78%, 75%, and 73% respectively. This is amazing to imagine. Think about it, Japan in 2050 with nearly 80% of its population over 65 years old. What will a country like that look like?
On the other end of the spectrum in the OCED – Mexico and Turkey are looking stable with only 35% and 37% of their population above 65 years old. This figure is approximately already what the average OCED country is at. The US, Canada, Australia, and New Zealand all look stable with a healthy inflow of immigrants that aid in slowing the growth in elderly people as a fraction of the overall population. Side note: South Korea is projected to undertake the most drastic population change. It is currently one of the youngest countries in the OCED, but in 40 years it will be among the oldest – moving from 19% of its population over 65 to over 70% by 2050.
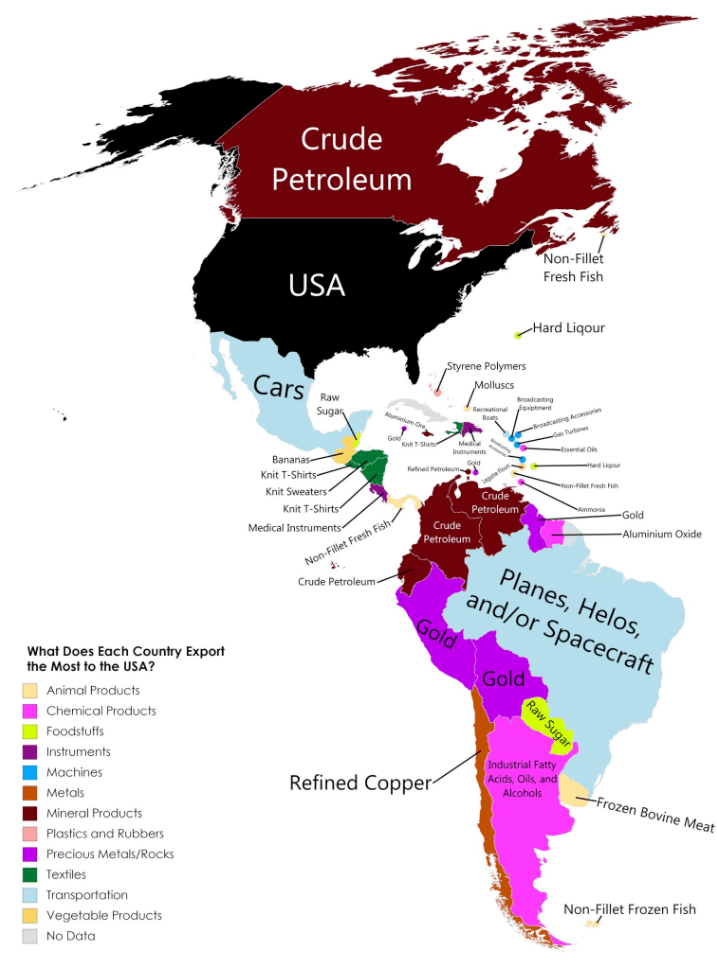
The map above displays each country in the Americas largest export to the United States. It is color coded by various categories listed in the legend. Note that Cuba is grayed out with “No Data” as the US does not trade with them due to the long-standing embargo. Latin America’s two largest economies (Brazil and Mexico) export industrial goods to the US – Planes, Spacecraft, and Cars – while most other countries in South America export natural resources (Sugar, Gold, and Oil). The Caribbean typically exports food products and textiles: bananas, fish, t-shirt, sweaters, etc.
