The United State and South Korea are outliers in the developed world with male circumcision rates above 50%. Most of the world’s countries and population are uncircumcised, many with percentages around only 10%. The map above displays each country’s male circumcision rate.
Author Archives: bradjballard
The World’s largest Islands
Australia is considered one of the world’s six continents, although some consider it the world’s largest island. If this is the case, the map above displays Australia’s land area compared with the next largest islands in the world. The next closest (in area) to Australia is Greenland with an area only 27% the size, followed by New Guinea at only 10% the size of Australia. The top 20 largest islands by area are displays and listed on the right.
Europe GDP per Capita (PPP) 2017
Above is a map of Europe displaying whether a country has a GDP per capita less than or greater than Turkey. The data is from the IMF in Oct 2017. Turkey has a GDP per capita of $24,912 at Purchasing Power Parity (PPP). The data displays the income divide Europe where all of western Europe and Russia (labeled in Blue) have a higher standard of living than Turkey and most the former USSR and former Yugoslavia countries (labeled Red) have a lower standard of living than Turkey. The income differences help to explain some of the internal migration within Europe.
Average Number of Years at Tech Companies
In the largest and most competitive tech companies, the average tenure by employees is approximately two years. The chart above displays the average number of years an employee spent working for various large tech companies.
The Country Across the Ocean
The map above displays the western hemisphere and shows with extending a horizontal line (longitudinal) which country is across the ocean from it. This is an interesting perspective from which to view the world given that these matching countries are likely to share the same climate and culture based on their position in the world. It’s amazing to see the north-south size of Africa projected onto the Americas – Its northern reach with Morocco across from (approximately) Washington DC in the United States to its southern point with South Africa across from Buenos Aires. Another stunning display is the north-south size of Japan which it the closest country to virtually the entire west coast of the US.
Pro Sports Height and Weight
Above is a scatter plot of height (y-axis) and weight (x-axis) for professional athletes in the five major sports in the United States: NFL, NBA, MLB, NHL, and MLS. The data points displayed are averages at different positions in the sport. For example, the average point guard in the NBA is 6’2” 185 lbs whereas the average center is 6’11” 250 lbs. The average US man (approximately 5’9” 190 lbs) is labeled in white. Keep in mind that only 14.5% of US men are taller than 6 foot and only 3.9% are taller than 6’2”. Given that the average height for the shortest position in the NBA is 6’2”, virtually 96% of the US population is eliminated for consideration on height alone.
Another thing that stands out is the weight difference in the NFL compared to other major sports. Every position averages a higher weight than the average US man. A big driver of this is the ‘arms race’ of teams drafting larger and larger offensive linemen and subsequently larger defensive linemen in response. Below is a bar chart displaying the number of players in the NFL that weighted over 300 pounds in ten-year intervals. In 1980, only 3 players weighted over 300 pounds – today average offensive lineman is 6’5” 312 pounds.
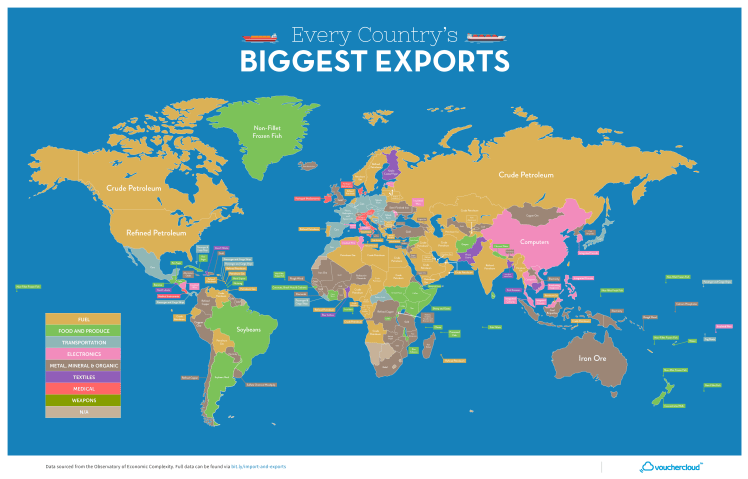
Coke, Soda, or Pop
The United States has various regional quirks, one of which is what do you call a carbonated soft drink. Where I grew up in Ohio, we called it a Pop. As in, can you give me a pop? When I moved to South Carolina, I noticed that everyone referred to it as a ‘Coke’ – even if they were talking about another soft drink. Now where I live in California, it’s called a Soda.
The World in Money
Above is a map of the world displaying each country’s currency projected on top of the country’s territory. There are 180 currencies in the world – the British pound is the world’s oldest currency that’s still in use, dating back to the 8th century! Despite all these currencies, the exchange market is dominated by only a few (shown in the bar chart below). The US dollar and Euro makeup between 60-70 percent of the market and additionally about 30 percent of the world use the USD/Euro or have their currency pegged to one of them.
Religion in China
China is a large and diverse country with stark geographic differences. One particular regional difference is religion. The Communist Party of China is officially atheist and party members are strongly discouraged from holding religious faith, however, China does officially sanction five religious organizations – Buddhism, Taoism, Islam, Protestant Christianity, and Catholicism (the Chinese Patriotic Catholic Association is not recognized by the Vatican). Above are six maps of China, each showing the regional concentration of the largest faiths in China. The northwestern desert region is Islamic, the southwestern mountainous region is Buddhist, the northeast is Chinese folk religions, and the southeast Taoist.
The above maps may be a little misleading as they display the percentage for various religions, but the scale on each map is different and the population in the western provinces are much smaller than the eastern ones. For example, the Christianity scale only goes up to 7% (for the darkest shade) whereas Buddhism reaches a high of 70% and Islam 50%. Overall, the majority of Chinese are unaffiliated with any religion or practice some ancient folk religion (73% of the population). The other major religions are Buddhism 16%, Taoism 7%, Christianity 2%, and Islam 0.5%.
Africa Birth Rate
No continent in the world outside of Africa averages more than 2.5 children per women – Africa averages 5! A society or country will remain at the same population level if it remains at the replacement level – 2.1 children per women – below this point, the location’s population is decreasing. Africa’s rate of 5 children per women is well above the replacement level, if fact, at this rate the continent will double in population in the next 30 years. As shown in the map of above, much of this growth is happening between Sub-Saharan Africa and north of southern Africa.
It also important to note the differences in birth rates intra-country. Nigeria is the most populous country in Africa with 185 million people and is the 7th largest in the world. Its fertility rate is 5.5 children per women which is the highest rate for any country already above 100 million people. The fertility rate is not evenly distributed (as pictured below) with a high rate of 8.4 children per women in rural northern regions compared with 3.8 in coastal urbanized areas. A staggering statistic is that: According to 2013 data, approximately 17% of Zamfara state’s women (the highest figure of 8.4 on this map) are currently pregnant!