Political Cartoon Map, 2016

Political comedy.png

Above is a cartoon map displaying Europe’s current political climate. Trump re-writing the NATO agreement, the Baltic States pushing back Russian expansion into Eastern Europe, Britain moving further away from the EU after their Brexit vote – what else stands out to you from the map?

Country Exports to the US

US imports from Americas.png

The map above displays each country in the Americas largest export to the United States. It is color coded by various categories listed in the legend. Note that Cuba is grayed out with “No Data” as the US does not trade with them due to the long-standing embargo. Latin America’s two largest economies (Brazil and Mexico) export industrial goods to the US – Planes, Spacecraft, and Cars – while most other countries in South America export natural resources (Sugar, Gold, and Oil). The Caribbean typically exports food products and textiles: bananas, fish, t-shirt, sweaters, etc.

Europe Income Brackets

POST_Europe GDPpc.png

Above is a map of Europe color-coded into three income brackets – Dark green: greater than 40k euros per capita, Light green: between 20k and 40k euros per capita, and red: less than 20k euros per capita. Note the values are calculated in Purchasing Power Standards (PPS) a metric used by Eurostat for cross-country comparisons. PPS tires to correct for cost of living and price level differences, especially among nations with different currencies. For comparison to the United States, 40k euros converts to 44k dollars (2017 prices). US GDP per capita is 55k dollars, with the highest continental state: New York at 72k USD and lowest: Mississippi at 35k USD. This means the area’s in dark green in the map above (among the highest in Europe) would rank on the lower end of US states, around 40th out of 50.

Total World Wealth, 2016

POST_TotalWealth.png

Wealth is a different concept than income. Income is what you earn with your labor (your job) and wealth is the assets you own minus your liabilities (or debt). Said differently, the accumulation of income and property passed from generation to generation over time is wealth. Income inequality has been growing in the United States over the past 30 years and is a hot button issue, but wealth inequality is a different and even more extreme situation – especially at the global level: The richest 1% of adults in the world hold 50% of global wealth, while the top 10% hold 85%!

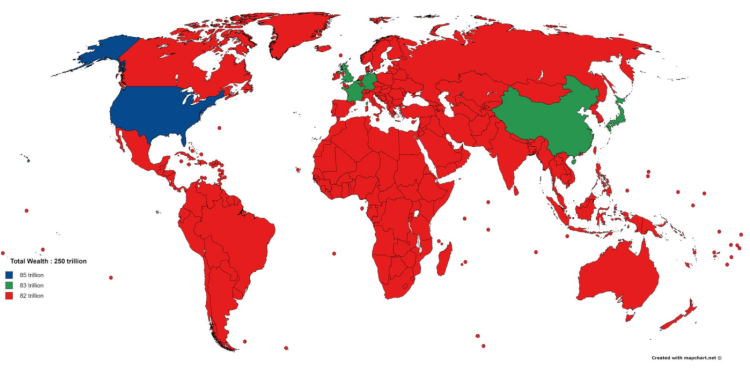
The total wealth of the world is estimated to be $255 trillion dollars by Credit Suisse in 2016. Of this, $84 trillion (33%) was located in the United States. Other wealthy countries include: Japan $24 T, China $23 T, UK $14 T, Germany $12 T, and France $11 T. One way to picture this distribution is with the map above colored in three tiers – The US has 1/3 of world wealth, Japan-China-UK-Germany-France combined have 1/3 of world wealth, and the remainder of the world, some 188 countries, have 1/3 of world wealth.

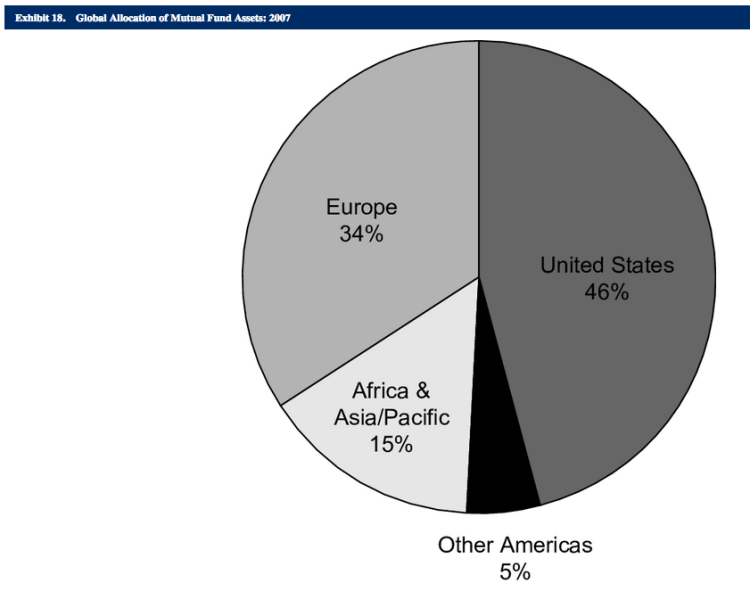
What are the assets that make up this wealth? Real estate is a large fraction of the total. Numbers are difficult to find but of the $84 trillion dollars of wealth in the US, $27 T (32%) of the value was real estate (2014 estimate). Another large fraction is located in financial assets: ownership of stocks, bonds, etc. This market is also concentrated with stock exchanges in the United States or Europe representing 80% of the global allocation of mutual fund assets.

POST_Global allocation of mutual fund assets.png

China’s Population Density

Screen Shot 2017-04-12 at 9.37.57 AM.png

Only about 30 percent of China’s landmass is habitable with approximately 40% of it’s land covered by mountains (in the southwest) and an additional 25% deserts (in the northwest). The maps above display that 94% of China’s population lives on the eastern side of it’s territory. The map below displays the location of China’s deserts and arid regions.

China and India make of 40% of the world’s population and although this figure seems strikingly high, estimates from 1 AD indicate the China and India combined for 60% percent of world population back then! Anyone who has visited either country is aware that both have very high population density. For comparison, world population density is 140 people per square mile – India is about 10 times that with 1008 people per square mile (ppsm) and China is 370 ppsm. Given what we know about the geography of China, this density estimate is quite low and once discounting it’s uninhabitable land, China’s density is more around 1233 ppsm. (Given that about 25% of India’s land is uninhabitable, a more direct comparison would put India density at 1344 ppsm). For those interested, here is the population density for some other countries: European Union (UK included) 304 ppsm, United States 85 ppsm, Brazil 62 ppsm, Russia 21 ppsm, and Canada 9 ppsm.

Screen Shot 2017-04-14 at 2.59.30 PM.png

Expansion of Russia

Screen Shot 2017-03-20 at 12.45.13 PM.png

Russia is the world’s largest country in area with nearly 11% of the world’s landmass. This area is approximately the size of the United States and Canada combined! It is a transcontinental country with territory extending into Europe and Asia. In fact, its Asian land portion alone makes it the largest country in Asia and its European land portion alone makes it the largest country in Europe! Above is a map displaying the expansion of Russian territory from 1613 to 1914. Despite all this growth in territory over the years, approximately 80% of Russia’s population still lives in the Green or Yellow portions on the map above (territory Russia controlled dating back to 1613).

College Basketball Final Fours, since 1975

Screen Shot 2017-03-26 at 5.09.42 PM.png

The map above displays the number of Final Fours reached by each school since 1975 (the year the NCAA tournament was expanded to 32+ teams). Side note: Only teams that have reached at least 2+ Final Fours are displayed in the map above (29 teams). Regionally, the upper south dominates college basketball with many of its teams reaching the final four, such as: North Carolina with 14 final fours, Duke 13, Kentucky 11, and Louisville 8.