Import Partners – US, EU, China, or Russia

ImportPartners.png

The map above displays from whom countries import more from – either the US, EU, China, or Russia. Border countries import the most from their neighbor country and this trading influence propagates outward. Generally speaking, the US is the export center for a North American zone, France+Germany for a European zone, Russia for a Eurasian zone, and China an Asian zone + the nearly the entire southern hemisphere.

Advertisement

Expensive Cities

rj65zma2r0121.png

It’s tough to compare costs across cities in different countries, but this study tries to do just that. It’s trying to answer the question: What is the average cost of a weeklong holiday trip to selected cities? The question is subject to the predefined assumptions – The trip is for two adults staying in Airbnb, walking & public transit, and doing typical tourist daytime activities like visiting museums, shows, or day-trips.

The graphic above is color-coded by region. The range of costs across cities in the sample fit closely to a normal distribution with the majority of cities falling in the $1000-2000 cost window. Africa and Asia have most of the cheaper cities while Western Europe and Coastal cities in the USA are the most expensive to visit.

Top 50 Cities by GDP Comparision 2014

Screen Shot 2018-06-03 at 11.05.07 AM.png

Visit the link to interactively play with the data: https://public.tableau.com/profile/brad.ballard#!/vizhome/Top50CitiesbyGDPComparision/Dashboard

We often see lists of GDP by country, but rarely by city. This is puzzling because most countries are empty space and GDP output is concentrated in a few small areas. For example, about 50% of US GDP is generated on only 2% of its area – namely: cities. This is also the case around the world.

To put the importance of these 50 cities into perspective. The top 25 cities in the world generate 15.5 trillion dollars in GDP or 20.1% of total world GDP (2014 numbers). They do this with only 4.7% of world population and have a GDP per capita of 44 thousand dollars (4 times world average). The top 50 cities in the world generate 22.6 trillion dollars in GDP or 29.4% of total world GDP (2014 numbers). They do this with only 8.2% of world population and have a GDP per capita of 37 thousand dollars (3.5 times world average).

The GDP centers are clustered in geographic regions in North America, Western Europe, and Eastern Asia. Only a few cities are represented from the southern hemisphere and none from Africa or the Middle East. Asian cities tend to be larger in population, number of skyscrapers, and lower in GDP per capita. North American and Europen cities tend to have small-to-medium populations, low density, and a high GDP per capita.

Screen Shot 2018-06-03 at 11.17.29 AM.png

World Urbanization Prospects 2014

The following are highlights from the World Urbanization Prospects 2014 report published by the United Nations Department of Economic and Social Affairs

Screen Shot 2018-04-05 at 12.22.49 PM.png

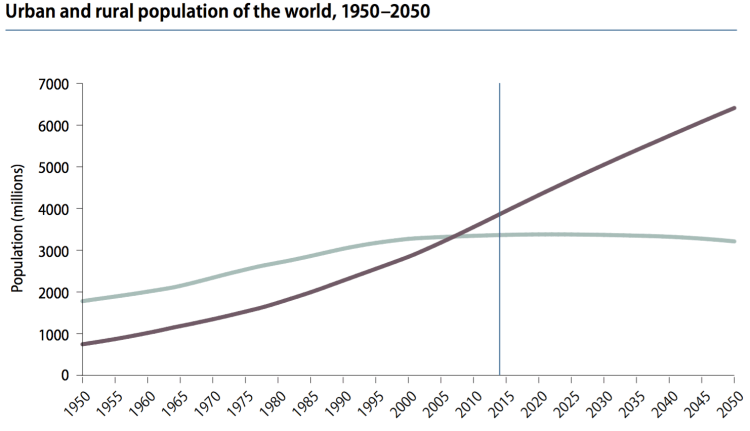
Globally, 54% of the world population lives in an urban area with at least 500k people. (note: urban in purple, rural in grey) The world has become more urban over time and is projected to continue.

Screen Shot 2018-04-05 at 12.15.17 PM.png

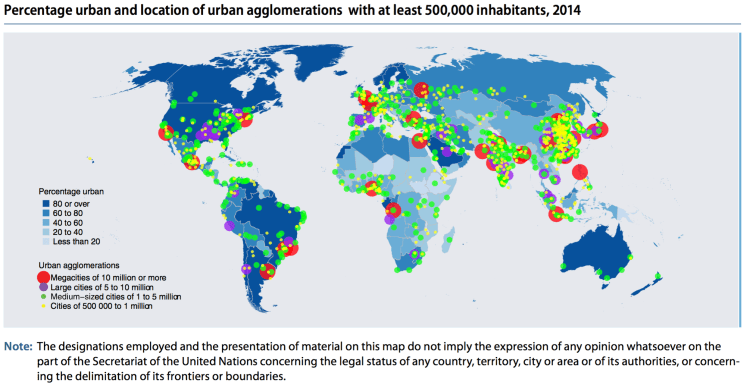
Urbanization differs across regions, with North American and Europe being the most urbanized — Africa and Asia least urbanized.

Screen Shot 2018-04-05 at 11.55.25 AM.png

High-income countries tend to be more urban (80%) than low-income countries (30%) — implying that urbanization and development are related

Screen Shot 2018-04-05 at 11.56.57 AM.png

Urbanized areas are displayed below in various groups (ranging from small cities to megacities) for the years 1990, 2014, and projected 2030.

Screen Shot 2018-04-05 at 11.58.24 AM.png

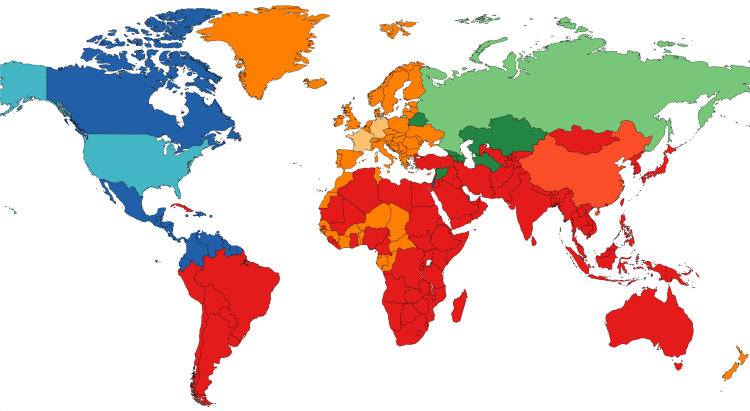
Urbanized areas (500k+ population) in 2014 are displayed on the map below

Screen Shot 2018-04-05 at 11.56.03 AM.png

Other interesting notes:

Africa and Asia are home to 90% of the worlds rural population and have the lowest rate of urbanization by content 40% and 48%.

China, India, and Nigeria will account for 37% of urban pop growth between now and 2050.

One in eight people live in one of the world’s 28 megacities (10m+ pop)

Link to the full report here: https://esa.un.org/unpd/wup/publications/files/wup2014-highlights.pdf

Europe GDP per Capita (PPP) 2017

Screen Shot 2017-11-10 at 12.17.54 PM.png

Above is a map of Europe displaying whether a country has a GDP per capita less than or greater than Turkey. The data is from the IMF in Oct 2017. Turkey has a GDP per capita of $24,912 at Purchasing Power Parity (PPP). The data displays the income divide Europe where all of western Europe and Russia (labeled in Blue) have a higher standard of living than Turkey and most the former USSR and former Yugoslavia countries (labeled Red) have a lower standard of living than Turkey. The income differences help to explain some of the internal migration within Europe.

European Union Unemployment Rate 2017

Screen Shot 2017-08-09 at 12.29.33 PM.png

Above is a map displaying the unemployment rate for European Union member states as of May 2017. What sticks out is the slow economic recovery for the southern European states post-financial crisis, such as: Greece (with an unemployment rate of) 22.5%, Spain 17.5%, Itlay 11.3%, and Croatia 10.7%. Contrast this with the unemployment rate in the United States during the same period of 4.3%. The EU average unemployment rate stands at 7.8%, nearly twice as high of the US! An economic analysis of labor policies in most EU countries leads to this result as there is less fixability in the labor force among other factors. Despite this performance for the European Union as a whole, some countries are performing above average and are on par with the US in employment rate such as: Germany, Austria, Czech Republic, UK, Poland, and others.

Sunset Times in Europe and America

SunsetNorthAm.png

Above is a map displaying the local sunset time on the summer solstice (June 20th), the longest sunlight day of the year. Time zones are indicated by gray vertical lines. You will notice that ‘local’ sunset time will vary based upon your east-west location within your time zone and also vary depending upon your north-south location within your time zone. Said differently, areas to the northwest within their time zones will have a later local sunset time. For example, eastern Alabama (far southeast) has a local sunset time before 8:00 pm, whereas northwestern North Dakota has a local sunset time close to 10:00 pm (both are in US Central Time Zone). Some areas are so far north that, during the summer months, they experience 24 hours of daylight (and conversely, during the winter months 24 hours of darkness). The map of Europe below also displays the local sunset time on the summer solstice.

SunsetEurope.png

Political Cartoon Map, 2016

Political comedy.png

Above is a cartoon map displaying Europe’s current political climate. Trump re-writing the NATO agreement, the Baltic States pushing back Russian expansion into Eastern Europe, Britain moving further away from the EU after their Brexit vote – what else stands out to you from the map?

Europe Income Brackets

POST_Europe GDPpc.png

Above is a map of Europe color-coded into three income brackets – Dark green: greater than 40k euros per capita, Light green: between 20k and 40k euros per capita, and red: less than 20k euros per capita. Note the values are calculated in Purchasing Power Standards (PPS) a metric used by Eurostat for cross-country comparisons. PPS tires to correct for cost of living and price level differences, especially among nations with different currencies. For comparison to the United States, 40k euros converts to 44k dollars (2017 prices). US GDP per capita is 55k dollars, with the highest continental state: New York at 72k USD and lowest: Mississippi at 35k USD. This means the area’s in dark green in the map above (among the highest in Europe) would rank on the lower end of US states, around 40th out of 50.