Import Partners – US, EU, China, or Russia

ImportPartners.png

The map above displays from whom countries import more from – either the US, EU, China, or Russia. Border countries import the most from their neighbor country and this trading influence propagates outward. Generally speaking, the US is the export center for a North American zone, France+Germany for a European zone, Russia for a Eurasian zone, and China an Asian zone + the nearly the entire southern hemisphere.

Advertisement

Tourism Rankings 2017

Screen Shot 2018-09-29 at 2.09.55 PM.png

The map above displays the world’s countries sized by international tourism receipts in 2017. The top ten can be seen in tabular view below:

Screen Shot 2018-10-07 at 8.43.46 AM.png

A few things jump out. The US gains more from international tourism than any other country by a factor of 3 and China spends more aboard than any other country by a factor of 2! Macau (ranked 9th) has three times the gambling revenue of Las Vegas, with much of this money origination in mainland China and spend ‘internationally’ in Macau. (Hong Kong ranks 11th with 33 billion in receipts in 2017) If Hong Kong, Macau, and Taiwan were counted as one country on this list, it would rank 2nd with 81 billion in receipts.

Screen Shot 2018-10-07 at 8.42.36 AM.png

FIFA World Cup Stats

Screen Shot 2018-07-03 at 8.35.03 AM.png

Above is map is displaying the number of top 4 finishes for each country in the World Cup (1930 – 2014). The size of the bubbles represents the number of top 4 finishes and is located in the geographic area of the country. Europe is colored blue, South America red, and North America green. This map is intended to display the concentration of top teams in Europe and South America — there has only been a few times ever that a team outside those two regions finished in the top 4. This same data is shown below in a bar chart.

Screen Shot 2018-07-03 at 8.38.27 AM.png

Below is the historical performance of the top 8 teams in the World Cup.

Screen Shot 2018-07-03 at 8.21.00 AM.png

Below is FIFA’s historical ranking for countries. The FIFA world ranking formula was created in 1993 and the average ranking from then until June 2018 is shown on the third column. Brazil is the worlds top team with an average ranking of 3rd, next Germany with an average of 5th — tied with Spain and Argentina.

Screen Shot 2018-07-03 at 8.55.30 AM.png

Political Cartoon Map, 2016

Political comedy.png

Above is a cartoon map displaying Europe’s current political climate. Trump re-writing the NATO agreement, the Baltic States pushing back Russian expansion into Eastern Europe, Britain moving further away from the EU after their Brexit vote – what else stands out to you from the map?

Total World Wealth, 2016

POST_TotalWealth.png

Wealth is a different concept than income. Income is what you earn with your labor (your job) and wealth is the assets you own minus your liabilities (or debt). Said differently, the accumulation of income and property passed from generation to generation over time is wealth. Income inequality has been growing in the United States over the past 30 years and is a hot button issue, but wealth inequality is a different and even more extreme situation – especially at the global level: The richest 1% of adults in the world hold 50% of global wealth, while the top 10% hold 85%!

The total wealth of the world is estimated to be $255 trillion dollars by Credit Suisse in 2016. Of this, $84 trillion (33%) was located in the United States. Other wealthy countries include: Japan $24 T, China $23 T, UK $14 T, Germany $12 T, and France $11 T. One way to picture this distribution is with the map above colored in three tiers – The US has 1/3 of world wealth, Japan-China-UK-Germany-France combined have 1/3 of world wealth, and the remainder of the world, some 188 countries, have 1/3 of world wealth.

What are the assets that make up this wealth? Real estate is a large fraction of the total. Numbers are difficult to find but of the $84 trillion dollars of wealth in the US, $27 T (32%) of the value was real estate (2014 estimate). Another large fraction is located in financial assets: ownership of stocks, bonds, etc. This market is also concentrated with stock exchanges in the United States or Europe representing 80% of the global allocation of mutual fund assets.

POST_Global allocation of mutual fund assets.png

US Federal Land

Screen Shot 2015-01-29 at 8.44.26 PM.png

The United States Federal Government controls a significant portion of the US total land – it controls 2.27 billion acres – more than 28% of the country’s total area. That figure is more than the territory of France, Spain, Germany, Poland, Italy, UK, Austria, Switzerland, The Netherlands, and Belgium combined! Further, it does not include State owned land which accounts for an additional 196 million acres pushing the combined Federal/State land ownership to approximately 35% of US total land area.

Screen Shot 2016-08-28 at 10.44.33 PM.png

Russian Military Bases Aboard

POST_Russian military bases.png

Overseas military bases enable a country to conduct expeditionary warfare and maintain order in their respective areas of control. The vast majority of countries in the world are not powerful enough to exhibit influence outside their defined boarders – they have a difficult enough time maintaining order within ‘their’ country as is. In fact, there are only 9 countries that have a military base located outside their own territory. Further, most of these countries only have influence (bases) around countries that boarder them and are not much of a global force.

The map above displays the location of Russian military bases aboard. All of these are located in former USSR and other past communist allies. Russia has 9 bases located in another country’s territory, fourth most by a country in the world. Below is a list of the 9 countries that have bases located in other nation’s territory (note – this is not the number of total bases, but the number of countries that listed country has bases located in):

Japan – 1, China – 1, India – 2, Turkey – 4, Italy -5, Russia – 9, UK – 13, France – 14, USA – 63

Another way to look at this is:

All other countries combined – 47, USA – 63


United Nations Veto Power

Screen Shot 2012-10-04 at 10.04.31 AM.png

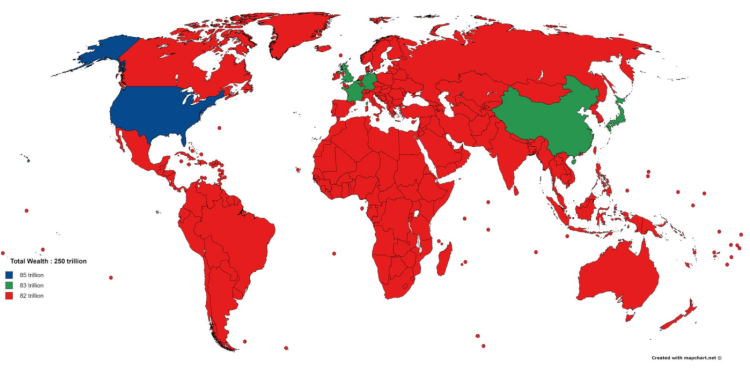
A criticism of the United Nations Security Council is the veto power of the five permanent nations – China, France, United Kingdom, United States, and Russia. A veto from any one of these nations can halt any possible action the Council could take. This veto may cripple any UN armed or diplomatic response to a crisis somewhere in the world.

Above is bar chart displaying the number of vetoes by the five permeant members of the UN Security Council. Typically in the western media it is presented that, time and time again, if it where not for vetoes from China or Russia the West could have intervened and prevented some conflict. Yet, a look at history presents a counter narrative.

Early in the history of the UN, the USSR used it’s veto power frequently. From 1945 to 1966 the USSR had a total of 105 vetoes compared to 6 for the four other members combined! However, over the next decades the situation reversed itself.

From 1986 to 2007, the United States took a dominate position using it’s veto power 36 times compared to 18 for the remaining four members. Combining the UK and France with the US (the UK and France voted in combination with the US on all of their vetoes) the total is: Western nations – 47, Others – 7. Further, John J. Mearsheimer is quoted that “since 1982, the US has vetoed 32 Security Council resolutions critical of Israel, more than the total number of vetoes cast by all the other Security Council members.”

POST_UN veto 1986-2007.png

To be fair, since 2007 there has been a large uptick in vetoes cast by Russia and China – virtually all them concerning the situation in Syria and the Ukraine. The total vetoes from 2007 to present are: Russia – 9, China – 5, France, UK, US combined – 1. Further, China voted with Russia on all 5 of it’s vetoes.