Tech Company Age

Facebook, LinkedIn, and Salesforce are tech companies with the youngest median employees age, each below 30 years old. Compare that to older tech companies (both in terms of company age and employee age) such as IBM, Oracle, and HP – each with median employee ages older than 37 years.

POST_TechAge.png

Tech Job Locations

POST_TechJobs.png

There are approximately 4 million technology related jobs located in the United States – that number translates to about 2% of the US labor force working in tech. How does that 2% figure compare with tech concentrated cities around the country? The graphic above displays the number of tech jobs per 1000 jobs compared with the annual salary of tech workers. What’s striking at first glance is that not only do tech workers make higher incomes the more tech jobs are concentrated, but they make exponentially higher incomes. This finding seems to indicate that tech workers skill sets compliment each other leading to an exponential increase in each worker’s productivity.

Not surprisingly, Silicon Valley tops the list (by a large margin) in the number of tech jobs per capita by city (or region in this case). Silicon Valley has approximately 13% of it’s workforce working in tech – almost 7 times the US average of just 2%. Further, the next closest city to this figure is San Francisco at 8%, literally the next closest city to Silicon Valley by proximity. SV and SF also lead in annual salaries for tech workers in large cities following the model’s prediction above. Other leading tech concentrations are: Washington D.C. with 7.8% of it’s workforce in tech, Seattle 7.6%, Austin 6.4%, Boston 5.2%, and Denver 4.6%

Anatomy of Mass Shootings

POST_Mass shootings.png

If you are involved in a mass shooting (defined as gun related death of four or more people) the event will most likely have the following statistics: It will take place at your workplace (49%), will be from a white (59%) male (96%) that will have prior signs of mental illness (45%) and the weapon will have been obtained legally (79%) of the time.

Gun Policy and the US Congress

Screen Shot 2016-07-11 at 1.12.07 PM.png

Gun Control is a polarizing issue between the two major parties in the United States. Of representatives currently serving in congress (the 114th) the split is clear – 93% of Republicans support gun rights, while 97% of Democrats support more gun control. With virtually no overlap between the parties, it seems the only way to change existing gun policy is for one party to have a clear majority across each level of government – the House of Representatives, the Senate, and the President.

Gun Deaths by Country

Gun deaths.png

With proposed gun regulations in the news in the US, its insightful to ask –  how does the United States compare with other developed countries in gun violence? Above is a graphic displaying the number of gun related deaths per 100k population for all 34 countries in the OECD (Organization for Economic Cooperation and Development), a group of the most developed nations in the world.

There is one clear outlier – the US has 2 to 3 times the number of gun related deaths per capita than all other comparable countries. Although the number gun related deaths have gone down drastically since the 1980’s, the United States still has twice the number of deaths per capita than the next highest OCED country. Numbers like these seem to indicate that more guns in a society lead to more gun related deaths – not less – as some pro-gun advocates remark.

US State Population Growth

US state pop growth.png

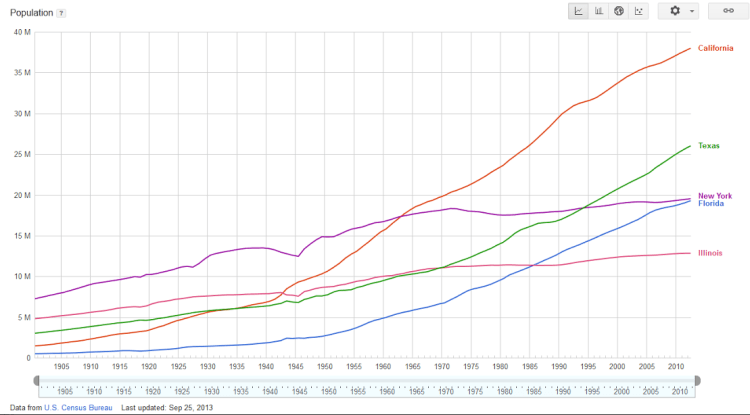
Above is a graph displaying the five most populous states in the United States from 1900 to 2013. These states – California, Texas, New York, Florida, and Illinois – combine for 119 million people, 37% of US total population.

What’s striking from the graph above is the growth behavior from California, Texas, and Florida compared to New York and Illinois – the latter leveling off and the former having exponential growth. California and New York had the same population in the mid 1950’s, now California is twice as populous as New York.

State population projects are displayed in the table below. California is expected in grow to 44 million people by 2030, Texas to 31 million, and New York to 22 million.

Screen Shot 2016-06-12 at 9.02.42 PM.png

Texas Population Map

Screen Shot 2016-04-10 at 11.40.07 AM.png

Texas is the second most populated State in the United States with 26.4 million people. More than 70% of Texas’ population is concentrated within the “Texas Triangle” cities of Houston, Dallas, and San Antonio. This triangle contains 5 of the 20 largest cities in the United States and upwards of 17.7 million people.

Screen Shot 2016-06-12 at 8.50.28 PM.png

California Population Map

Screen Shot 2016-04-10 at 11.38.40 AM.png

Above are two maps displaying California. The one on the left is a ‘normal’ map displaying each county by relative area size and colored by population density – red more dense and green less dense.

The map on the right is distorted relative to population size. What is striking is how much of California’s population is concentrated in the Bay Area and Los Angeles/San Diego. The Central Valley (between SF and LA) and Northern California (above San Francisco) despite their large area, make up a small proportion of California’s total population. For comparison, the Bay Area and Los Angeles/San Diego make up 26 million of California’s 38 million residents.