Github Users 2017

Github is the world’s largest host of source code in the world with more than 57 million repositories. The site also has 26 million users as of March 2017. Software engineers and programmers actively use Gitbub to post projects and to collaborate in teams using versions control. It’s interesting to ask where do these programmers live – who and where is the user base on the site?

Mapping_collaborative_software_on_GitHub.png

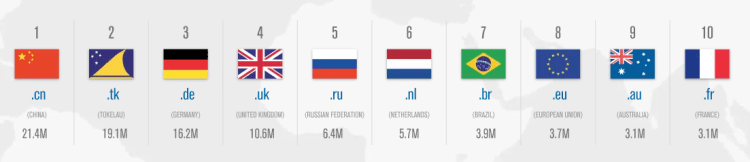
The map above displays the percentage of Github users by country and commits per country. The United States comprises 31% of Github’s users and 35% of Github commits. The next largest country is the United Kingdom with 6% of users and 7% of commits. Followed by Germany (5%, 6%) and China (6%, 5%). The top ten countries compose 70% of the users and over 70% of the commits. They are: US, UK, Germany, China, France, Brazil, Canada, India, Russia, and Japan.

Advertisement

The World in Domain Names 2017

8ceucvu7hmlz.jpg

Screen Shot 2017-09-16 at 12.41.30 PM.png

Above is a map displaying the online world, that is, each country’s size on the map represents the number of websites registered to each country code top-level domain (ccTLD). What is clear is there is a large concentration of internet activity in a small number of countries – as of June 2017 there were 302 global ccTLD, the top 10 (shown above) compose 64.8% of all ccTLD domain name registrations.

Two other things jump out from the map above:

First, why is Tokelau (.tk), a New Zealand territory in the south Pacific – a county with a population of 1,499 people – second in the world with 19.1 million domain name registrations? Tokelau has specialized in web hosting by allowing any individual or business to register any number of domain names free of charge with very minimal restrictions or oversight. These policies have lead .tk domains to have a bad reputation. According to a 2011 report by the Anti-Phishing Working Group, .tk domains were involved in ~21.5% of all phishing attacks in the second half of 2010 internet-wide.

Second, why is the .us ccTLD not among the world’s largest? The United States is such an internet world power that most of its the first websites were already registered and growing their brand on Generic top-level domains (gTLD) before ccTLD domains were developed and extended for country-specific use. Americans are more familiar with gTLDs such as: .com, .org, .net, .info, .gov, .edu, and .mil – and have been low to transfer to the ccTLD .us. To have a more accurate picture of the internet world map – as of 2017, across all gTLDs, there were 331.0 million registered domains and only considering .com, .net, .org, and .info (the top 4 gTLDs combined) there are 160.6 million registered domains. Compare that with .cn (China’s top domain) the second most used domain in the world with only 21.4 million. The graph below displays the top ten domains, both ccTLD and gTLD combined – the US has four of the top ten in the world (all gTLD).

Screen Shot 2017-09-15 at 12.24.10 AM.png

Deep Learning research by country

AI.png

Above is a bar chart displaying the number of research papers published each year on Deep Learning. Two trends are noticeable: One, Deep Learning/Artificial Intelligence research is on the rise across all the most advanced nations in the world and, Two, China and the US are far outpacing the nearest competitor countries. There is also an A.I. patent battle underway being waged mostly in Silicon Valley (Apple, Facebook, Google) and Seattle (Amazon, Microsoft). AI2.png

(Graphics from MIT Technology Review 2017)

Netflix Subscription Growth

Screen Shot 2017-01-22 at 8.30.49 PM.png

The subscription growth of Netflix over the past 5 has been stunning, especially when you consider the performance of its competitor: cable. As of the fourth quarter in 2016, Netflix now has more subscribers than total cable subscribers – growing from under 25 million in 2012 to nearly 50 million by 2016. Note that these figures only include US domestic subscribers, not global users. Global subscribers are expected to rise as Netflix expanded into new markets in Africa, Asia, and Eastern Europe (pictured in the graphic below). It seems that people are not watching less TV, rather watching it through a different and more mobile friendly medium.

Netflix and the world.png

House Prices and Tech

POST_TechHousing.png

The bar chart on the left displays the number of technology related jobs per 1000 jobs for select cities. The bar chart on the right displays the median house price for the same cities on the left. What jumps out from this comparison is how expensive house prices are in the Bay Area compared with other tech centers around the country. Despite having roughly the same number of tech related jobs (7.9% and 7.6%) home prices in San Francisco are more than two and a half times more expensive than homes in Seattle (1.2 million compared with 430k). Another finding is that even if cities have a higher fraction of their laborforce working in tech jobs, most cities in this sample do not have home prices far above the US Average.

Tech Job Locations

POST_TechJobs.png

There are approximately 4 million technology related jobs located in the United States – that number translates to about 2% of the US labor force working in tech. How does that 2% figure compare with tech concentrated cities around the country? The graphic above displays the number of tech jobs per 1000 jobs compared with the annual salary of tech workers. What’s striking at first glance is that not only do tech workers make higher incomes the more tech jobs are concentrated, but they make exponentially higher incomes. This finding seems to indicate that tech workers skill sets compliment each other leading to an exponential increase in each worker’s productivity.

Not surprisingly, Silicon Valley tops the list (by a large margin) in the number of tech jobs per capita by city (or region in this case). Silicon Valley has approximately 13% of it’s workforce working in tech – almost 7 times the US average of just 2%. Further, the next closest city to this figure is San Francisco at 8%, literally the next closest city to Silicon Valley by proximity. SV and SF also lead in annual salaries for tech workers in large cities following the model’s prediction above. Other leading tech concentrations are: Washington D.C. with 7.8% of it’s workforce in tech, Seattle 7.6%, Austin 6.4%, Boston 5.2%, and Denver 4.6%

Internet speeds

Internet speed.png

As more of the economy and economic growth is intertwined with the internet – speed and connectivity are highly important to the success of countries in the 21st century. As displayed above, there is large disparities in internet access and connectivity speeds between countries in the developed world and in undeveloped areas.

In the 2015 Q3 ranking by Akamai, the top ten countries by average connection speed (in Mb/s) were: (1) South Korea 20.5, (2) Sweden 17.4, (3) Norway 16.4, (4) Switzerland 16.2, (5) Hong Kong 15.8, (6) Netherlands 15.6, (7) Japan 15.0, (8) Finland 14.8, (9) Latvia 14.5, and (10) Czech Republic 14.5.

In comparison to other developing countries in the world: Mexico ranks 68th at 5.5 Mb/s, China 91st at 3.7 MB/s, Brazil 93rd at 3.6 Mb/s, and India 116th at 2.5 Mb/s.

The United States is ranked 16th in the world by average connection speed at 12.6 Mb/s, slightly above average in the developed world. Although, the numbers are skewed in favor of small density connected countries without rural areas to bring the average down. The US average may be slower than some small dense northern European countries, but when compared the the European Union as a whole, the US is much faster – 12.6 Mb/s to 8.1 Mb/s.

If the US states where ranked individually, Washington D.C. would rank 2nd in the world in average internet connection speed, Delaware 3rd, Utah 6th, Massachusetts 7th, and Rhode Island 10th. As of 2014, the US state with the slowest average internet speed was Alaska at 7 Mb/s.

Screen Shot 2016-04-10 at 9.43.04 PM.png