World Legal Systems

World Legal systems.png

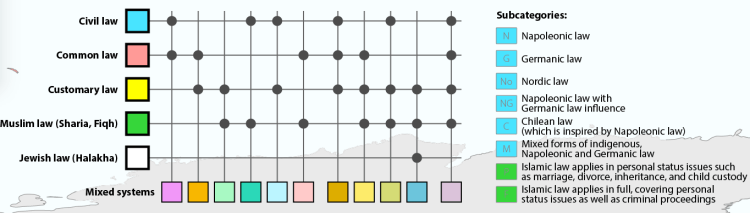
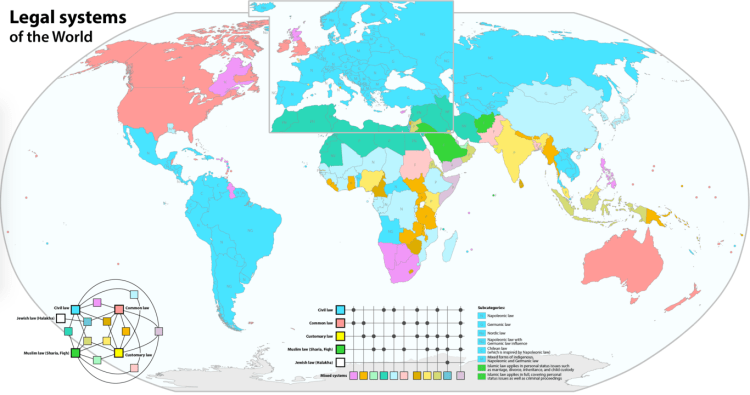
The legal systems of countries around the world can be said to fit generally into three distinctive categories – Civil law, Common law, and Sharia law. Civil law makes up the majority of countries in the world and is derived originally from Roman law and later the Napoleonic code spread by the French empire across Europe. Civil law can be described simply a law structure that is highly codified into a referable system. It leaves little room for interpretation from judges as each law should be referable to a previous statute.

In contrast to Common law, also know as case law or precedent law, is derived from the English legal tradition. Common law puts much more power into the hands of judges and their interpretation of the law over time.  These judge-made decisions create precedential authority to prior court decisions which bound the judge’s opinion to pervious court rulings. This legal system was spread by the British Empire to it’s dominions across the globe including: the United States, Canada, Australia, New Zealand, and is a hybrid system in many others.

Sharia law or Muslim law is present in muslim majority countries in the Middle East and North Africa. This legal tradition is derived directly from the Quran and was spread during Islamic Caliphate in 750 AD. The remaining parts of the world including most of the countries in Africa, South Asia, and Southeast Asia have some hybrid law system mixed between Civil, Common, Sharia, and Customary law. Refer to legend below for what category your country falls into.

Legal systems legend.png

Country Executions

The United States is the only country in the western world to still retain the death penalty. It is also with the minority of the world – just 58 of 198 countries (29%) have used the death penalty in the last 10 years.

The chart below displays the top 25 countries ranked by executions over the past decade. China and Iran ‘lead’ in this category by a large margin. Iran has the distinction of having highest number of execution per capita. Meanwhile in China, the number of executions is officially unknown and regarded as a “state secret” – Estimates range from as high as 2500 to 5000 per year, more than the rest of the world combined!

The United States does not fair very well either – 5th in the world in executions with 350 since 2007.

POST_Executions by country.png

United Nations Veto Power

Screen Shot 2012-10-04 at 10.04.31 AM.png

A criticism of the United Nations Security Council is the veto power of the five permanent nations – China, France, United Kingdom, United States, and Russia. A veto from any one of these nations can halt any possible action the Council could take. This veto may cripple any UN armed or diplomatic response to a crisis somewhere in the world.

Above is bar chart displaying the number of vetoes by the five permeant members of the UN Security Council. Typically in the western media it is presented that, time and time again, if it where not for vetoes from China or Russia the West could have intervened and prevented some conflict. Yet, a look at history presents a counter narrative.

Early in the history of the UN, the USSR used it’s veto power frequently. From 1945 to 1966 the USSR had a total of 105 vetoes compared to 6 for the four other members combined! However, over the next decades the situation reversed itself.

From 1986 to 2007, the United States took a dominate position using it’s veto power 36 times compared to 18 for the remaining four members. Combining the UK and France with the US (the UK and France voted in combination with the US on all of their vetoes) the total is: Western nations – 47, Others – 7. Further, John J. Mearsheimer is quoted that “since 1982, the US has vetoed 32 Security Council resolutions critical of Israel, more than the total number of vetoes cast by all the other Security Council members.”

POST_UN veto 1986-2007.png

To be fair, since 2007 there has been a large uptick in vetoes cast by Russia and China – virtually all them concerning the situation in Syria and the Ukraine. The total vetoes from 2007 to present are: Russia – 9, China – 5, France, UK, US combined – 1. Further, China voted with Russia on all 5 of it’s vetoes.


State Politics

POST_Screen Shot 2012-10-11 at 12.00.51 AM.png

The above graphic displays the number of visits by presidential candidates (hand waves) and the amount of money spent (dollars signs) per state during the 2004 election. What is quickly apparent is only a few states are (politically speaking) “important” – these states being the so-called “swing states”.

The map below shows what states were within in +/- 4% margin of victory between the two opposing parties during the 2012 campaign – namely: Ohio, Florida, North Carolina, and Virginia. Florida and Ohio are particularly important as they are both swing states and have large population. Florida has 27 electoral college votes (third most in the US) and Ohio has 20 (seven most). The relative importance of these states and other “swing states” are highlighted above in the amount money and visits by political candidates. Do you still think your vote counts?

Screen Shot 2016-03-06 at 9.15.03 PM.png

US Labor Market Trends

Over the past few decades the US labor market is undergoing some noticeable trends. One such trend is a consistent decrease in the percentage of the US population employed following a recession (highlighted in grey in the top graphic). This makes since as economic recessions cause unemployment, but a puzzling trends is following – After each of the past two recession the fraction of US population employed (the labor participation rate) has not returned to the previous pre-recession level. In 2001, labor participation was around 64.5%, but only returned to 63.5% by 2007 before the great recession hit. The 2007 recession’s impact has been even more drastic pushing labor participation down further to just 58.5%.

The US labor force composition is also changing quite drastically over the past 60 years. In 1950, the labor participation for men was 87% and for women 32%. That is, 87% of working age men where employed and just 32% of working age women. By 2010, labor participation for men fell to 70% and women’s participation rose to just under 60%. We are becoming a more gender neutral labor force.

POST_US labor market trends.PNG

Oil Imports

Screen Shot 2016-01-23 at 11.38.24 PM.png

In the mist of an energy production boom in the US, the amount of oil imported from foreign countries in 2014 fell to 27% (the lowest level since 1985). Over the past decade or so, the US as also been importing less oil from the Middle East region and increasing its imports from the Western Hemisphere (40% from Canada, 10% from Mexico, 10% from Venezuela). In fact, Canada accounts for 3.5 times the oil imports of Saudi Arabia to the US (3,401 thousand barrels per day compared to 983 thousand barrels per day).

Across the Pacific, China is increasing its reliance on Middle East oil — and presumably, as a result, increasing its presence in the region. In fact, in a recent New York Times article it was announced that China will be establishing its first overseas military output in Djibouti. The East African nation sits at the entrance point of the Red Sea — the waterway boarding Saudi Arabia to the east. As shown in the figure below, China now receives the majority (51.2%) of its oil imports from the Middle East and by 2035 imports from the region are expected to double. China oil imports.png

Coal Regulations

How will new coal regulations impact where you live? The map below displays the relative share of electricity generated by coal. Well known coal producing giants: Wyoming, West Virginia, and Kentucky — each of whom generate over 90% of their energy from coal — stand to lose most from new regulations that increase the price of energy derived from coal.

POST_US Coal.png

Energy Independence

Over the next several decades, many countries oil and gas dependence will grow as their nation’s economy expands. South Korea and Japan (in the upper right counter) are both already highly dependent on energy imports and will continue to remain so in the near future. Meanwhile in Europe, the persistent lack of economic growth is expected to lessen the upward trend in energy imports in the near term.

Developing Asia (China, India, and ASEAN) will see massive growth in oil and gas imports over the next 25 years as displayed by the drastic ‘up and to the left’ movement on the graphic below. One glaring outlier in the world energy picture is the United States —  who is currently undergoing a complete energy transformation due in large part to the break through technology of ‘fracking’. The United States will move from being the world’s largest energy importer to a net energy exporter!

20121117_woc449.png

Source: The Economist