Tourism Rankings 2017

Screen Shot 2018-09-29 at 2.09.55 PM.png

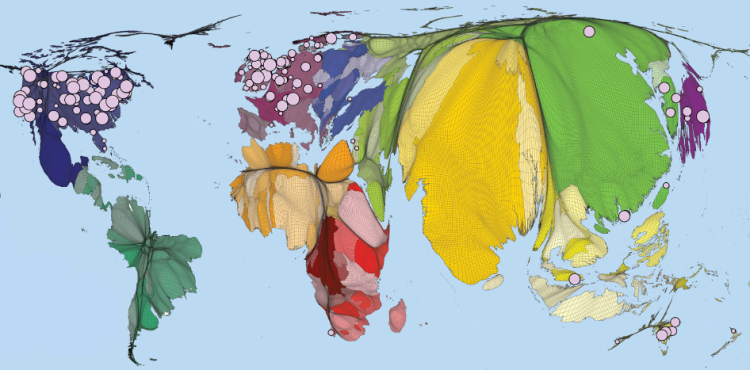
The map above displays the world’s countries sized by international tourism receipts in 2017. The top ten can be seen in tabular view below:

Screen Shot 2018-10-07 at 8.43.46 AM.png

A few things jump out. The US gains more from international tourism than any other country by a factor of 3 and China spends more aboard than any other country by a factor of 2! Macau (ranked 9th) has three times the gambling revenue of Las Vegas, with much of this money origination in mainland China and spend ‘internationally’ in Macau. (Hong Kong ranks 11th with 33 billion in receipts in 2017) If Hong Kong, Macau, and Taiwan were counted as one country on this list, it would rank 2nd with 81 billion in receipts.

Screen Shot 2018-10-07 at 8.42.36 AM.png

Advertisement

FIFA World Cup Stats

Screen Shot 2018-07-03 at 8.35.03 AM.png

Above is map is displaying the number of top 4 finishes for each country in the World Cup (1930 – 2014). The size of the bubbles represents the number of top 4 finishes and is located in the geographic area of the country. Europe is colored blue, South America red, and North America green. This map is intended to display the concentration of top teams in Europe and South America — there has only been a few times ever that a team outside those two regions finished in the top 4. This same data is shown below in a bar chart.

Screen Shot 2018-07-03 at 8.38.27 AM.png

Below is the historical performance of the top 8 teams in the World Cup.

Screen Shot 2018-07-03 at 8.21.00 AM.png

Below is FIFA’s historical ranking for countries. The FIFA world ranking formula was created in 1993 and the average ranking from then until June 2018 is shown on the third column. Brazil is the worlds top team with an average ranking of 3rd, next Germany with an average of 5th — tied with Spain and Argentina.

Screen Shot 2018-07-03 at 8.55.30 AM.png

European Union Unemployment Rate 2017

Screen Shot 2017-08-09 at 12.29.33 PM.png

Above is a map displaying the unemployment rate for European Union member states as of May 2017. What sticks out is the slow economic recovery for the southern European states post-financial crisis, such as: Greece (with an unemployment rate of) 22.5%, Spain 17.5%, Itlay 11.3%, and Croatia 10.7%. Contrast this with the unemployment rate in the United States during the same period of 4.3%. The EU average unemployment rate stands at 7.8%, nearly twice as high of the US! An economic analysis of labor policies in most EU countries leads to this result as there is less fixability in the labor force among other factors. Despite this performance for the European Union as a whole, some countries are performing above average and are on par with the US in employment rate such as: Germany, Austria, Czech Republic, UK, Poland, and others.

Deep Learning research by country

AI.png

Above is a bar chart displaying the number of research papers published each year on Deep Learning. Two trends are noticeable: One, Deep Learning/Artificial Intelligence research is on the rise across all the most advanced nations in the world and, Two, China and the US are far outpacing the nearest competitor countries. There is also an A.I. patent battle underway being waged mostly in Silicon Valley (Apple, Facebook, Google) and Seattle (Amazon, Microsoft). AI2.png

(Graphics from MIT Technology Review 2017)

Political Cartoon Map, 2016

Political comedy.png

Above is a cartoon map displaying Europe’s current political climate. Trump re-writing the NATO agreement, the Baltic States pushing back Russian expansion into Eastern Europe, Britain moving further away from the EU after their Brexit vote – what else stands out to you from the map?

Total World Wealth, 2016

POST_TotalWealth.png

Wealth is a different concept than income. Income is what you earn with your labor (your job) and wealth is the assets you own minus your liabilities (or debt). Said differently, the accumulation of income and property passed from generation to generation over time is wealth. Income inequality has been growing in the United States over the past 30 years and is a hot button issue, but wealth inequality is a different and even more extreme situation – especially at the global level: The richest 1% of adults in the world hold 50% of global wealth, while the top 10% hold 85%!

The total wealth of the world is estimated to be $255 trillion dollars by Credit Suisse in 2016. Of this, $84 trillion (33%) was located in the United States. Other wealthy countries include: Japan $24 T, China $23 T, UK $14 T, Germany $12 T, and France $11 T. One way to picture this distribution is with the map above colored in three tiers – The US has 1/3 of world wealth, Japan-China-UK-Germany-France combined have 1/3 of world wealth, and the remainder of the world, some 188 countries, have 1/3 of world wealth.

What are the assets that make up this wealth? Real estate is a large fraction of the total. Numbers are difficult to find but of the $84 trillion dollars of wealth in the US, $27 T (32%) of the value was real estate (2014 estimate). Another large fraction is located in financial assets: ownership of stocks, bonds, etc. This market is also concentrated with stock exchanges in the United States or Europe representing 80% of the global allocation of mutual fund assets.

POST_Global allocation of mutual fund assets.png

Island Nations

Screen Shot 2017-03-04 at 3.39.11 PM.png

Of the 193 UN member nations, 46 are island nations. This means that nearly a quarter of the world’s sovereign countries are islands. The largest island nations by population are Indonesia (260 million), Japan (126 m), Philippines (102 m), and the United Kindom (65 m). Of the 46 island nations, 13 are in the Caribbean, 13 are in Oceania, 10 are off the coast of Asia, 6 are off the coast of Africa, and 4 are off the coast of Europe.

For those wondering why Australia is not considered an island due to its status as the world’s smallest continent – The size comparison below shows the world’s largest island by area (Greenland) next to Australia. Australia is 3.5 times larger than Greenland!

Screen Shot 2017-03-04 at 3.49.11 PM.png

US Federal Land

Screen Shot 2015-01-29 at 8.44.26 PM.png

The United States Federal Government controls a significant portion of the US total land – it controls 2.27 billion acres – more than 28% of the country’s total area. That figure is more than the territory of France, Spain, Germany, Poland, Italy, UK, Austria, Switzerland, The Netherlands, and Belgium combined! Further, it does not include State owned land which accounts for an additional 196 million acres pushing the combined Federal/State land ownership to approximately 35% of US total land area.

Screen Shot 2016-08-28 at 10.44.33 PM.png

World University Rankings

Screen Shot 2016-05-07 at 10.14.44 PM.png

The graphic above displays a world map distorted relative to the population of each country and has pink bubbles indicating the location of the top 200 ranked universities in the world. The relative size of the bubbles indicate that the university is located closer to the top of the rankings and vise versa for smaller bubbles. What is striking about this map is the inequality of top universities globally, with virtually all of the top 200 schools located in the developed world.

Further, the concentration gets even more extreme at the very top of the rankings. From the 2015 numbers, the top 50 universities in the world are located in just 12 countries. The United States has a huge advantage in premier universities with 25 of the top 50 and 10 of the top 15! The next closest on the list is the United Kingdom with 7 in the top 50 (3 of these 7 in the top 10 – Oxford, Cambridge, and Imperial College London).

North America, Europe, and Australia account for 45 of the top 50 universities in the world. The remaining 5 located outside the western world are: National University of Singapore (26th), Peking University (42nd), University of Tokyo (43rd), University of Hong Kong (44th), and Tsinghua University (47th).

Russian Military Bases Aboard

POST_Russian military bases.png

Overseas military bases enable a country to conduct expeditionary warfare and maintain order in their respective areas of control. The vast majority of countries in the world are not powerful enough to exhibit influence outside their defined boarders – they have a difficult enough time maintaining order within ‘their’ country as is. In fact, there are only 9 countries that have a military base located outside their own territory. Further, most of these countries only have influence (bases) around countries that boarder them and are not much of a global force.

The map above displays the location of Russian military bases aboard. All of these are located in former USSR and other past communist allies. Russia has 9 bases located in another country’s territory, fourth most by a country in the world. Below is a list of the 9 countries that have bases located in other nation’s territory (note – this is not the number of total bases, but the number of countries that listed country has bases located in):

Japan – 1, China – 1, India – 2, Turkey – 4, Italy -5, Russia – 9, UK – 13, France – 14, USA – 63

Another way to look at this is:

All other countries combined – 47, USA – 63